Disclaimer: - As earthquake prediction is still in its infancy, the accuracy of information provided on this web-site cannot be guaranteed by the author, the web-site owner or the hosting organization, neither is any liability accepted by these persons or organizations for any incident or accident resulting out of actions taken by persons as a result of information posted herein.
Copyright of all items in this Earthtremors.com web-site is with the author.


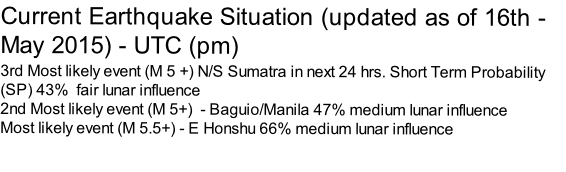
Earthquake Predictions for 16 May 2015 (pm) - see table
Notes
1) Lunar Score varies with time of month - relative to lunar phase and location
2) Statistical probability of recurrence of M6+ remains substantially unchanged until next M6+ events occur in the target locality
3) Weather Score (from 3 to 5 points) will only be added if significant weather pattern is noted
4) Primary Spatial score relates to 5 most recent M6+ events and magnitude
5) Secondary Spatial score relates to 5 most / recent M5+ events and Magnitude
6) High secondary spatial score or weather means likelihood of M5 event imminent
7) NB Short Term probability (SP) given for M6+ but would be higher for M5+ events
8) This page should be read in conjunction with hourly forecast from lunar/solar acceleration
No analysis has yet been carried out for areas of Northern Japan. Neither for many parts of other countries. However some idea may often be obtained by spatial interpolation, so that for example a high probability for General Santos and Surigao would most likely include similar probability for Davao (located between the two)
Note - Priorities can change very quickly if other events occur elsewhere in Pacific area - like Tonga, PNG, Solomons, Vanuatu, etc
|
Tested |
Lunar |
Weath er |
Probabi lity |
Primary |
Second ary |
Combin ed |
Priority |
Short Term |
|
Locations |
Score |
Score |
Return |
Spatial |
Spatial |
Total |
Rank |
Probabi lity |
|
N.Sumatra |
2.4 |
3 |
1.8 |
5 |
2 |
13.3 |
2 |
43% |
|
S.Sumatra |
2.4 |
3 |
1.8 |
5 |
2 |
12.8 |
3 |
43% |
|
W.Java |
2.4 |
2 |
1.8 |
2.4 |
1.7 |
9.8 |
9 |
36% |
|
Surigao |
2.8 |
2 |
0.9 |
2.2 |
1.4 |
10.4 |
6 |
48% |
|
Gensan |
2.8 |
2 |
0.7 |
0.7 |
0.9 |
8.4 |
11 |
42% |
|
Manila |
2.6 |
2 |
0.8 |
2.9 |
1.1 |
10.2 |
8 |
44% |
|
Baguio |
2.6 |
2 |
1 |
3.8 |
1.4 |
11.3 |
4 |
47% |
|
Taiwan |
2 |
2 |
1 |
1.6 |
0.5 |
10.2 |
7 |
29% |
|
Kyushu |
2.8 |
3 |
3 |
1.9 |
0.5 |
9.1 |
10 |
39% |
|
Hokkaido |
2.2 |
2 |
2 |
2.4 |
0.6 |
8.2 |
12 |
31% |
|
Tokyo |
2.8 |
3 |
2.7 |
1.8 |
0.7 |
10.7 |
5 |
58% |
|
E.Honshu |
2.8 |
3 |
5 |
4.8 |
0.4 |
13.8 |
1 |
66% |
|
Kuril |
2.2 |
2 |
2 |
2.4 |
0.6 |
8.2 |
12 |
44% |
|
Notes on scoring |
Max 8 points |
2 normal, 3 high |
Max. 4 points |
Max 5 points |
Max 2 points |
High most likely |
1 most likely |
|